See Your Business Through the Simple Numbers Lens
Upload your QuickBooks financials and instantly convert them into Greg Crabtree's Simple Numbers format — powered by AI
No credit card required
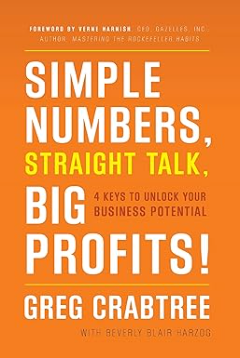
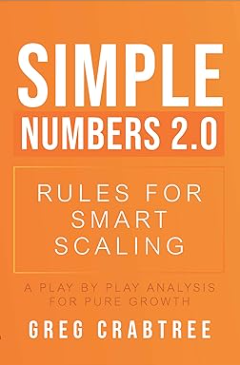
Based on the Books by Greg Crabtree
The methodology behind this tool comes from two essential reads for business owners.
How It Works
Upload
Upload your QuickBooks P&L and Balance Sheet Excel files
AI Classification
Our AI maps every line item to Simple Numbers categories
Instant Dashboard
See LER, profitability, Core Capital with traffic-light metrics
Key Metrics at a Glance
The six metrics that matter most in Greg Crabtree's Simple Numbers framework
Total LER
Total Labor / Gross Margin
Target: Below 0.55Direct LER
Direct Labor / Gross Margin
Target: Below 0.30Management LER
Mgmt Labor / Gross Margin
Target: Below 0.22Pre-Tax Profit %
Pre-Tax Profit / Revenue
Target: Above 10%Core Capital
Retained Earnings + Equity
Target: 2 months of OpExProfit to GM
Pre-Tax Profit / Gross Margin
Target: Above 15%See It In Action
Everything You Need
AI-Powered Classification
Automatically maps your chart of accounts to Simple Numbers categories
Monthly / R3 / R12 Views
See trends across monthly, rolling 3-month, and rolling 12-month windows
Edit Mappings Anytime
Override any AI classification and lock your preferred category mappings
Source Account Drill-Down
Click any Simple Numbers line to see which QB accounts roll into it
Traffic-Light KPIs
Green, yellow, and red indicators instantly show where you stand
Excel Download
Export your converted Simple Numbers report as a formatted .xlsx file
Shareable Links
Generate read-only links to share your dashboard with advisors or partners
Date Range Filtering
Focus on any time period within your uploaded data range
QuickBooks Ready
Works directly with standard QuickBooks Online P&L and Balance Sheet exports
How to Export from QuickBooks
Profit & Loss
- Go to Reports and open Profit and Loss
- Set the Report period to your desired date range (ideally 3 years)
- Under Display columns by, select Months
- Click Run report
- Click the Export icon (top right) and choose Export to Excel
Balance Sheet
- Go to Reports and open Balance Sheet
- Set the Report period to the same date range as the P&L
- Under Display columns by, select Months
- Click Run report
- Click the Export icon and choose Export to Excel
Important
- Both reports must use the same date range
- "Display columns by: Months" is required — the default is "Total Only" which won't work
- We recommend at least 2–3 years of history for meaningful trend analysis
- Use Accrual basis for the most accurate Simple Numbers analysis
- Export as .xlsx (Excel), not PDF or CSV